The Superposition Principle, The Fourier Series and Fourier Transform
MotivationThis tutorial covers the Suerposition Principle, the Fourier Series and the Fourier Transform. The Fourier Transform must be last by necessary order of learning, because it is based on the Fourier Series, which is, in turn, based on the Superposition Principle.
In engineering and science the Fourier Transform is used to break down a complex wave form by its frequency components. These components are the building blocks of waves. You can study a wave's components and better understand what gave rise to it, and you can take out and add components in order to alter its nature. One of the uses for it can be to look at sound waves propagating speech to better understand how speech works. You could also remove certain frequencies that are causing noise in order to better see the signal you want to look at, or you could add components to change the nature of a sound. But, Fourier applies to all waves across all medium, so you can apply them to light waves, sound waves, etc.
Road Map
Here are key concepts this tutorial will cover:
- Superposition Principle
- Fourier Series
- Periodicity
- Fundamental Frequency
- Fundamental Period
- Orthogonality Principle
- Fourier Coefficients
- DC Coefficient
- Sinusoidal Coefficient
- Frequency Domain (aka Frequency Spectrum)
- Non-Periodicity
- Fourier Transform
The Superposition Principle
The diagram below is a simple sinusoidal wave. A sinusoidal wave is the simplest wave possible. The diagram is of a sine wave.Waves travel as sinusoids or as a set of sinusoids.
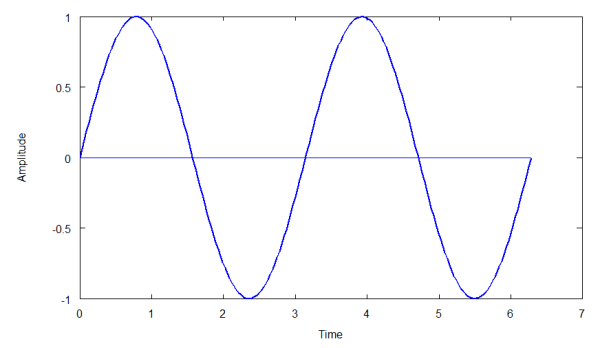
This wave is the same shape as the simple harmonic motion you see in a mass-spring system and for the same reason. The system oscillates around an equilibrium point describing a sine wave as a graph of time versus displacement. With a sound wave (pressure wave), the air compresses and expands (rarifies) around an equilibrium pressure.
A sinusoid is described by three elements: an amplitude, a frequency and a phase. The wave above can be described by "a sin(wt + ph)", where 'a' is the wave's amplitude, 'w' is the angular frequency (so many radians per second), 't' is the time, and ph is the phase shift, or how far from the y-axis the wave starts. In the above case ph = 0.
[TODO: diagram of a spring mass system]
Complex Waves
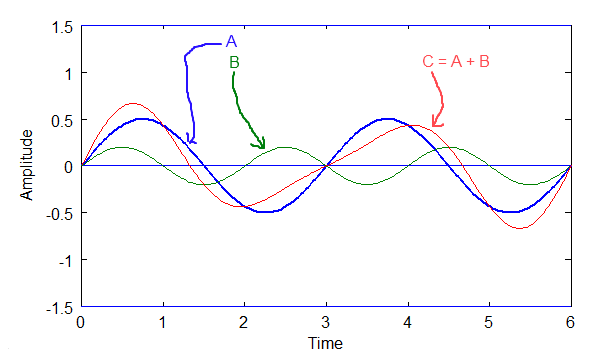
Complex waves are the composition of two or more sinusoids of varying frequency, amplitude and phase. The diagrams below show two simple sinusoids, 'A' and 'B', each of different amplitude and frequency (phase is the same). 'C' is the composition, or sum, of 'A' and 'B', i.e. C = A + B. C is a complex wave, because it is made up of two sinusoids.
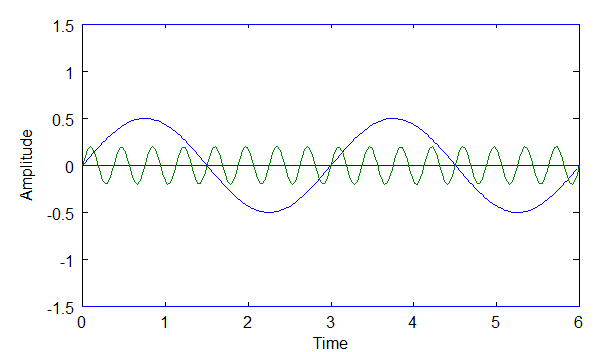
Above: diagram of sine waves A and B.
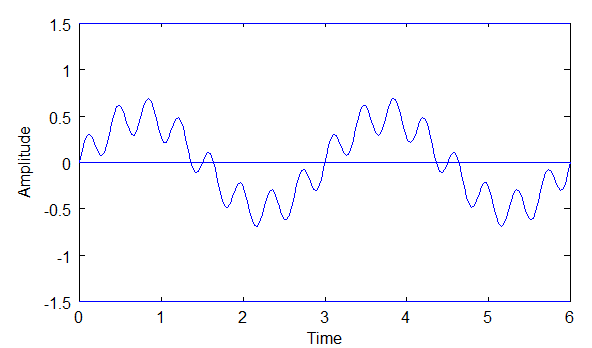
Above: diagram of sine wave C, where C = A+B.
The diagram of C reflects the Superposition Principle, which states that two or more sine waves can traverse the same path at the same time in a medium and when they do they do not interfere with each other. In other words, both waves are still there and each can be extracted from the complex wave.
The Fourier Series and The Superposition Principle
The Superposition Principle Does Not Always HoldIt was Joseph Fourier (1768 - 1830) who showed that any periodic wave can be represented by a sum of simple sine waves. This sum is called the Fourier Series. The Fourier Series is based on the physics of real waves, whether electromagnetic waves, sound waves, or whatever the medium they are in. The Fourier Series follows from the Superposition Principle.
The Superposition Principle does not always hold, and the Fourier Series only holds when the Superposition Principle does. The Superposition Principle does not hold when the waves are so big that they "break" the medium and it does not bounce back. This is akin to breaking a spring in an oscillating spring-mass system because the oscillations are too big for the spring to handle. In the air, an explosion is an example of something that can break the linear effect so that sound waves are no longer sinusoidal.
The Fourier Series Only Applies to Periodic Waves
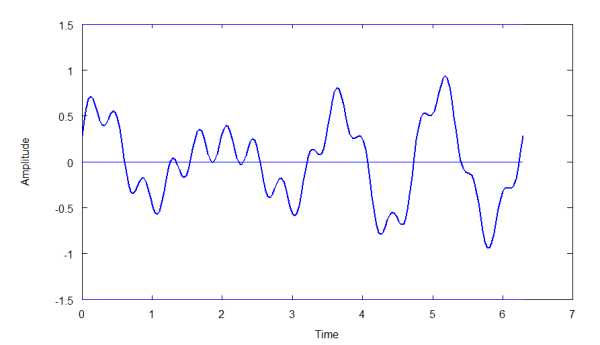
The Fourier Series only applies to "periodic" waves. This is a key point that must be understood to understand the Fourier Series versus the Fourier Transform. A periodic wave is a wave with a repeating pattern. It is that repeating pattern that determines the wave's frequency, or wavelength. This frequency is referred to as the "fundamental frequency" (and the corresponding wavelength is the "fundamental wavelength"). Non-periodic waves will be dealt with later (the job of the Fourier Transform). Below are examples of periodic and non-periodic waves.
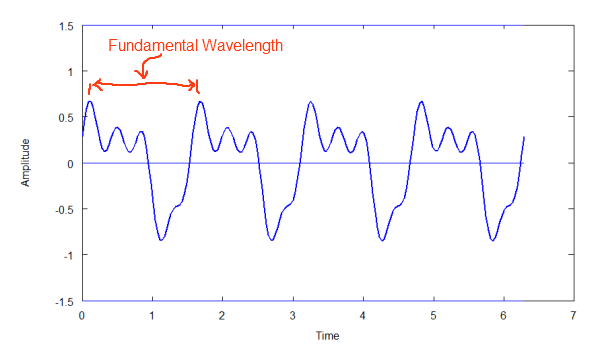
Above: Diagram of periodic wave above. Repeating Pattern.
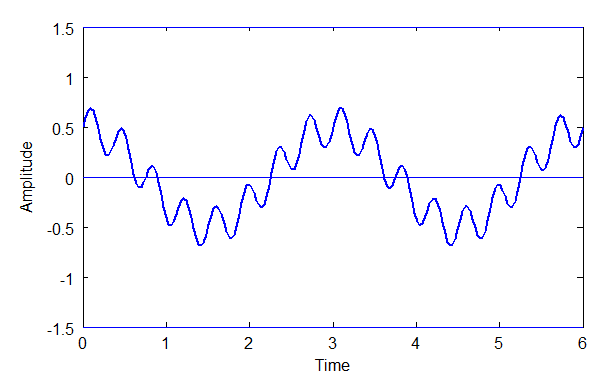
Above: Diagram of non-periodic wave. Non-repeating pattern.
Note: the non-periodic wave above does not repeat over the visible portion of the wave. It may be that it does repeat if you extend the length of the graph. There is no fundamental frequency for a non-periodic wave.
Periodic Wave Components Are Integer Multiples of The Fundamental
 The fundamental frequency is the frequency of a periodic wave's repeating pattern, or how long its wavelength is. Below is a complex periodic wave composed of two simple sinusoids. Sinusoid 'A' has wavelength of 3 units (the units are immaterial for this discussion) and sinusoid 'B' has a wavelength of 2 units'. The composition of A and B, wave C, results in a wavelength of 6 units. That is, those two waves in combination create a fundamental wavelength of 6.
Above: Diagram of C=A+B. A and C are integer multiples of C
Notice that the sinusoidal components of C must be integer multiples of C's frequency. This is necessary if the wave is to be periodic, otherwise the pattern would not repeat. So, the physics of periodic waves makes this necessary. The math to check this is simple, so it might be a good exercise for you to try it yourself.
This is why the composite waves of a periodic wave must be integer multiples of the fundamental frequency,f. So, in the diagram above, A's frequency is 2*f, B's is 3*f, and C's = f. Remember, A and B are what give rise to C.
Brief Foray into the Fourier Transform
A Fourier Transform builds on the basic idea of the Fourier Series. A Fourier Transform allows us to describe non-periodic (and periodic) waves. These are waves that do not have a repeating pattern. I'll show how to derive this after the Fourier Series is more fully described, but order of learning requires the Fourier Series be understood first.
The Fourier Series Equation
|
Reproducing the diagrams for the Superposition Principle below, let's see how a complex wave can be described.
Above: Diagram of sine waves A and B.
Above: Diagram C, where C = A + B.
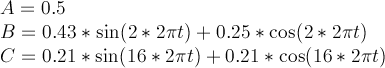
From the diagrams above we know that C = A + B. Also, A = 0.5 * sin(2wt), and B = 0.2 * sin(16wt). So, if f(t) represents the complex wave, then:
Equation 1
Equation 1 is wave C represented by a Fourier Series.
Note, the 'w' is the "angular frequency", usually given in radians per second. 'w = 2*pi*f0', where f0 is thefundamental frequency of the wave. Notice that wave A has a frequency twice the fundamental ( 2wt ) and wave B has 16 times the frequency of the fundamental (16wt).
Phase Shift, ph
Phase shifts must also be handled, because a sinusoid can be shifted along the x-axis. If wave A above were shifted by, say, 90 degrees, or pi/2, then the results would look as follows:
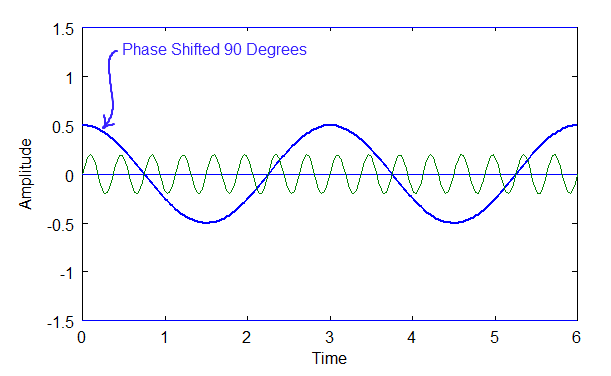
Above: Diagram of two waves, A and B, one phased shifted, A.
Above: Diagram of C, where C = A + B.
Phase shifting doesn't affect the fundamental frequency. It only affects the wave's shape.
Equation 2
The DC Components
A wave can also have a constant or DC component or signal that shifts a sinusoid up or down the y-axis so that it no longer oscillates around y = 0. The term "DC" comes from "direct current". It's an artifact of electronics, due to the fact that Fourier is often used in dealing with electrical signals. However, DC in Fourier does not have to be an electrical signal. It's just the constant part of any signal, regardless of whether or not the medium is electric, electromagnetic, pressure, etc.
Below are is a DC component, A, and sinusoid B, and the composition of both to produce wave C, which is simply the shifting upward of B.
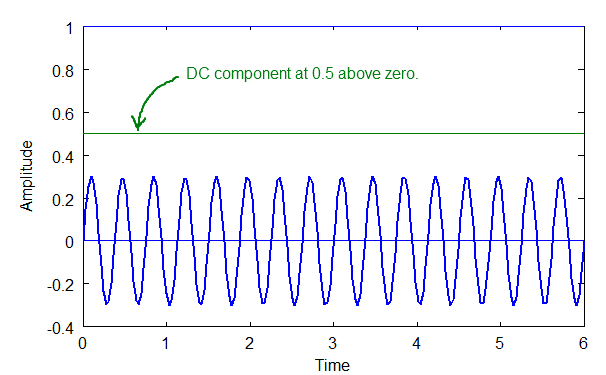
Above: A DC Component, 'A', and a sine wave, 'B'.
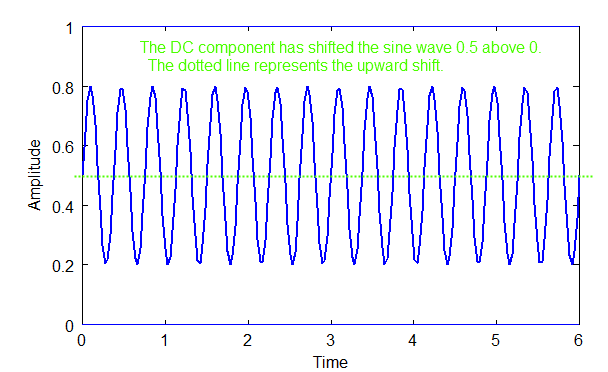
Above: diagram of C = A + B.
The equation for the complex wave, C, above would be:
Equation 3
The General Form of the Fourier Series
First a brief summary of what we've learned so far. The Fourier Series applies only to periodic waves. All of the components of a periodic waves are integer multiples of the fundamental frequency. We also know that each component has its own phase and amplitude. We also must account for a DC component if it exists. Assembling these facts, here is the general form of the Fourier Series:
Equation 4
where a0 is the DC component, and w = 2*pi*f and f = the fundamental frequency.
A More Common Representation of the Fourier Series
More often the Fourier Series is represented by a sum of sine and cosine waves (and often as complex notation, e^jwt. I'll get to that later). I believe the reason for this is because deriving the coefficients in this form is easier. Here is the form:
Equation 5
This form eliminates the phase.
The equation 5 is made possible by the trigonometric identity shown in equation 6, below.
Equation 6
Note, a "wave component", or sinusoid, can be referred to as a "harmonic" or "partial".
Converting A Complex Wave To A Fourier Series
|
We now know that a Fourier Series can represent any periodic wave when the Superposition Principle holds. The next question is, given a complex periodic wave, how can we extract its component waves?
Two Methods are Required
Two methods are required for this. One method is used to extract the DC component and the other method is used to extract the "partials", or sinusoids. What we are extracting in these cases are the coefficients for the Fourier Series.
Extracting The DC Component
|
If you integrate over the full period of a sinusoid, the area found will be zero. This is also true if you integrate over the full period (fundamental wavelength) of a complex periodic wave that is composed only of sinusoids. The diagram below shows this.
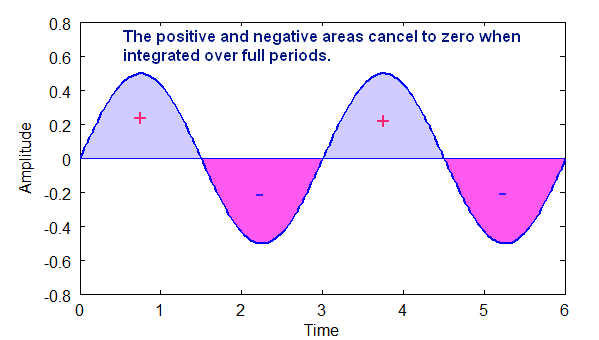
Above: Diagram shows how the area of a sine wave is zero when integrated over whole periods.
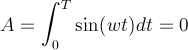
The area above the x-axis is positive area and the area below the x-axis is negative area. For a sinusoid the total area over one or more periods is always zero.
So, if there is no DC component in a complex, periodic wave, the area over the period of that wave will be zero.
If there is a DC component, however, then there will be a non-zero (positive or negative) area over that period.
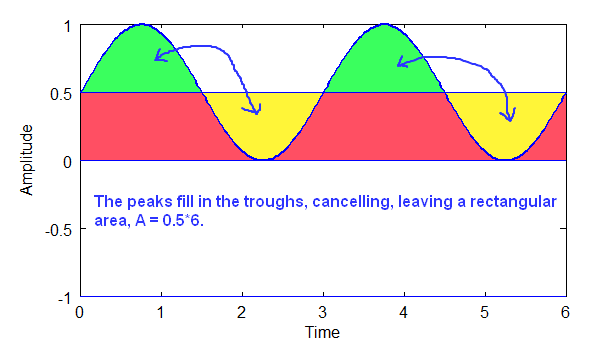
Above: Diagram shows how sinusoidal components cancel, and the remaining area is the DC part, a rectangle.
Given that T is the period of the wave, and A is the area of the DC component rectangle, the coefficient a0 is A/T. The DC component is 0.5 in the diagram above, which is the area divided by the period. In the example above, integration is over two full periods. All of the sinusoidal parts cancel to zero, so they can be ignored!
Extracting The Coefficients of the Sinusoids
|
To extract the coefficients of the sinusoids a trigonometric identity is required, the orthogonality principle.
The Orthogonality Principle
Here again is the general form of the Fourier Series:
Equation 1
Here we want to extract the sine wave and cosine wave components of a complex, periodic wave. In the equation above that means coefficients a1, a2, a3, ... and b1, b2, b3, ....
The orthogonality principle only holds when sine waves are integer multiples of each other, such as is the case for periodic waves! So, this principle beautifully works for a Fourier series. The principle applies to both sine waves and cosine waves.
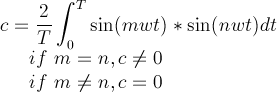
Equation 2
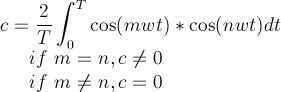
Equation 3
Equations 2 is the orthogonality principle for sine waves and equation 3 is the orthogonality principle for cosine waves. If the integers m and n are not equal, this means that the total area will be zero. However, if m and n are equal, the total area will be some non-zero number.
This principle, or method, allows you to take a complex wave function, f(t), and extract the coefficients for the sine and cosine waves for the Fourier series that describes that function. Below are the two key equations, 4 and 5, for Fourier Series coefficient extraction.
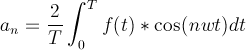
Equation 4
Equation 5
So, if you are given a complex wave form, f(t),with a fundamental period, T, then you can extract the coefficient values for the Fourier Series, equation 1, to describe that complex wave using equations 4 and 5 above. This often takes a great deal of meticulous work, because each coefficient for each integer multiple of frequencies of the sine and cosine components has to be extracted one at a time. Today we rely on high speed computers to speed this process up by several orders of magnitude.
How The Orthogonality Principle Works
Now that we have the equations and an understanding of how to pull out the coefficients, next we will look under the hood to see how orthogonality works.
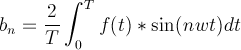
The graph below shows how the total area is positive when two sine waves (or cosine waves) have the same frequency:
Above diagram shows how two waves of the same frequency result in a net positive area.
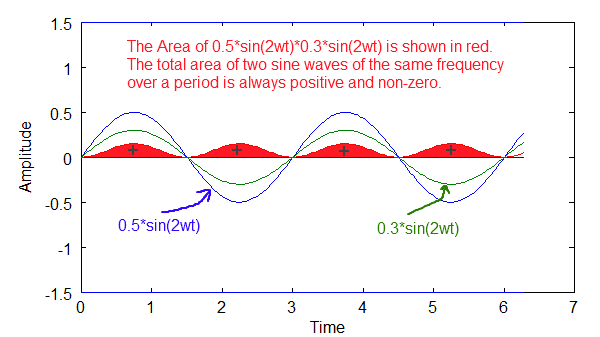
The graph below shows how the total area is zero when two sine waves have different m's and n's. In this case m=2 and n=3.
Above diagram shows how the total area is zero when the sine waves have different frequencies.
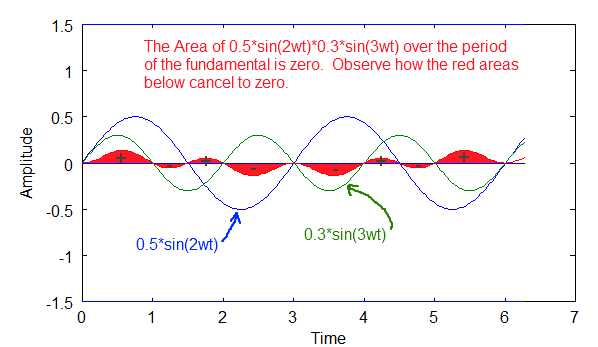
The graph below is another example of how the total area is zero when m and n are not equal. In this case m+2 and n = 4.
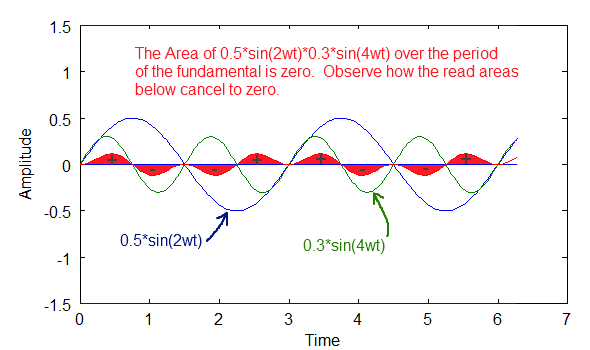
Above diagram shows an example of how the total area is zero when the sine waves have different frequencies.
So, imagine a complex, periodic sinusoidal wave, f(t). It is composed of several sinusoidal components, but we don't know what they are yet. Using the orthogonality principle thus:
[equation to extract coefficient at a frequency using orthogonality with f(t)]
We can check to see if a frequency exists or not. If the frequency does not exist, then the area of a sinusoid will be zero. If the frequency exists, we will get a non-zero value, which will be that coefficients value. We need to check each frequency in turn to see if it exists or not, which, admittedly, is a lot of work (digital methods, DFT and FFT speed this up tremendously). We do this for both the sine part and the cosine part. The sine and cosine of a particular frequency are what determine the phase of the sinusoid. We discussed that when we looked at the general equation of the Fourier Series.
Orthogonality for sin(mwt)*cos(nwt)
There is one more identity required to tighten this up. Orthogonality for sine and cosine is always zero.
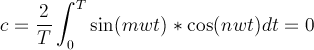
Equation 6
So, this means that the sine and cosine elements will not interfere with each other when extracting one or the other. Below is a graph showing how the total area is zero for a cos(mwt)*sin(nwt). In this case, it is always zero for all integer multiples, m and n.
Above diagram shows how the area is zero when a sine wave and cosine wave are multiplied and integrated over the fundamental period.
The Frequency Domain
|
Once you know the fundamental frequency and the coefficients of the Fourier Series, you can graph any complex wave in a frequency domain (aka frequency spectrum) and completely describe that wave. Frequency domain plots are often easier to analyze and understand than time domain wave plots are.
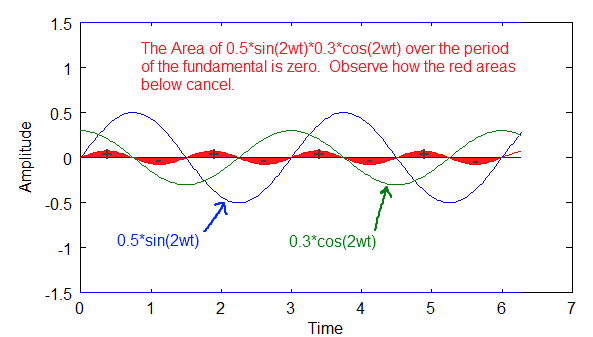
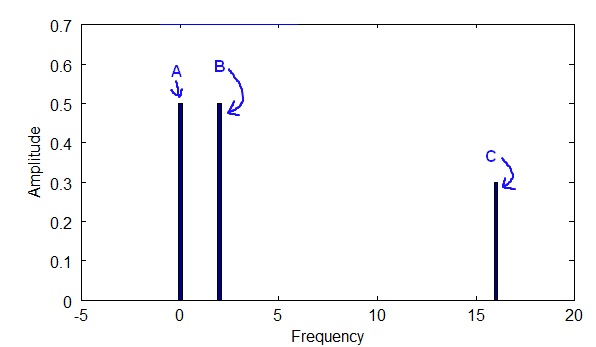
Example, below are two time wave plots of simple waves and a composite complex, periodic wave made from those two components:
Above: The components of a time wave in the time domain. Components A, B and C.
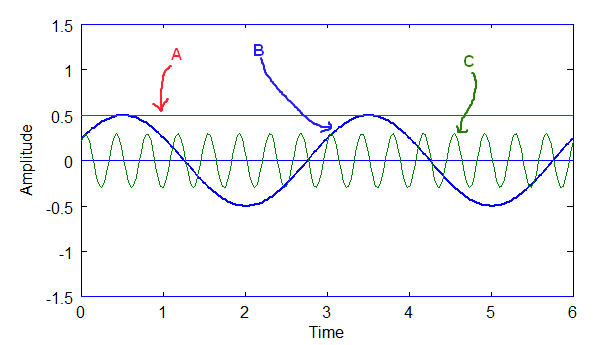
Above: The time wave, D, where D = A + B + C.
The diagrams above are ground we've already covered and should be understood at this point.
A frequency plot of the above wave is a plot of the magnitudes of the sinusoidal components at their respective frequencies, along with a plot of the DC component at frequency 0.
The DC component above is A = 0.5
The sinusoidal component B = 0.5 * sin(2wt + 0.52)
The sinusoidal component C = 0.3 * sin(16wt + 0.78)
Now, Fourier is most often broken down into sines and cosines, which allows us to deal with phase shift. Remember the trigonometric identity introduced earlier:
Equation 1
Using this identity, B = 0.5* cos(0.52)*sin(2wt) + 0.5*sin(0.52)*cos(2wt)
and C = 0.3*cos(0.78)*sin(16wt) + 0.3*sin(0.78)*cos(16wt)
For B, the magnitude of the sine part b2 = 0.5*cos(0.52) = 0.43, and the magnitude of the cosine part is a2 = 0.5*sin(0.52) = 0.25.
For C, the magnitude of the sine part b16 = 0.3*cos(0.78) = 0.21, and the magnitude of the cosine part is a16 = 0.3*sin(0.78) = 0.21.
The Fourier Series equation for this particular case has these parts:
Equation 2
The full equation is thus:
Equation 3
So, here is the frequency plot of f(t) = D = A + B + C:
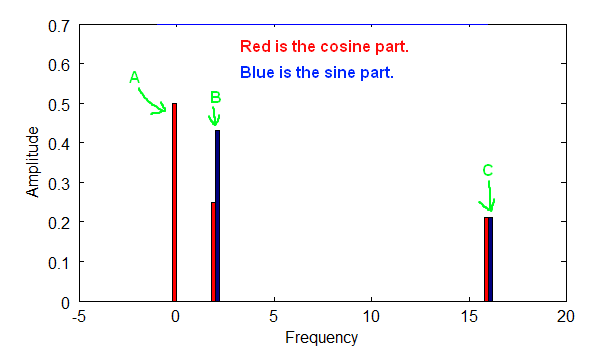
Above is a diagram of a frequency plot with both the cosine and sine parts for each frequency.
In the diagram above the sine and cosine parts in combination provide both the phase and magnitude for each frequency. In the above case the fundamental frequency is 1, but it could have been anything. A is at frequency zero, which simply refers to the DC part of the signal, i.e. the non-wave part. B is at 2 times the fundamental frequency, and C is at 16 times the fundamental frequency.
The Fundamental Frequency is the f part of w, where w = 2*pi*f. Notice how the plot points are only at integer multiples of the fundamental frequency, which follows from the nature of periodic waves, and from the way the orthogonality principle works. That frequency plot fully describes wave D, and can be used to reconstruct D if we so wish. Both the sine and cosine components of each wave are shown.
Another more common way that frequency spectrums are plotted is by combining the sine and cosine terms to get the magnitude of the wave at each frequency for the Fourier Series equation.
Equation 4
And phase angle can be calculated thus:
Equation 5
Below is a plot of the magnitudes for each frequency:
Above diagram shows the frequency plot for the magnitude at each frequency.
The Fourier Transform And Non-Periodic Waves
|
Now for the more general case. The Fourier Transform allows us to solve for non-periodic waves, while still allowing us to solve for periodic waves. It builds upon the Fourier Series. We now know that the Fourier Series rests upon the Superposition Principle, and the nature of periodic waves. The sinusoidal components are integer multiples of the fundamental frequency of a periodic wave. The fact that they are integer multiples allows us to use the orthogonality principle to extract the coefficients of the complex wave.
But, how do we apply this to non-periodic waves?
Note the following about periodic waves. The longer the wavelength of a periodic wave, the closer together the sinusoidal components will be along the frequency spectrum. In other words, the longer the fundamental wavelength, the smaller the fundamental frequency.
For example, we have three different fundamental wavelengths and their associated fundamental frequencies as shown below, equation 1:
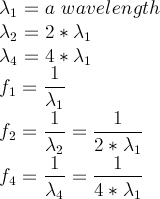
Equation 1
Now, if I were to plot the frequency domain for each of these fundamental frequencies I'd get the following threespectrum densities. The hash marks in the diagrams below represent the frequencies that are identifiable.
Above: diagram shows the density of frequencies you would see with fundamental frequency f1.
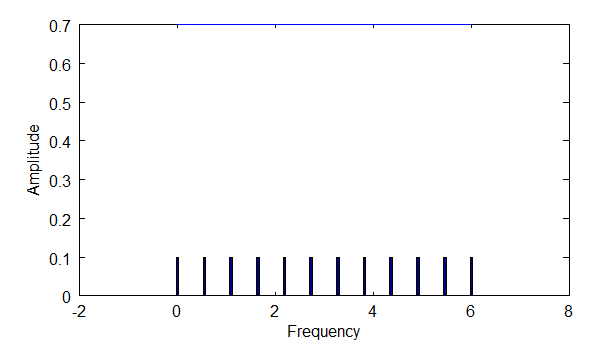
Above: diagram shows the density of frequencies you would see with f2, which is 2 times f1.
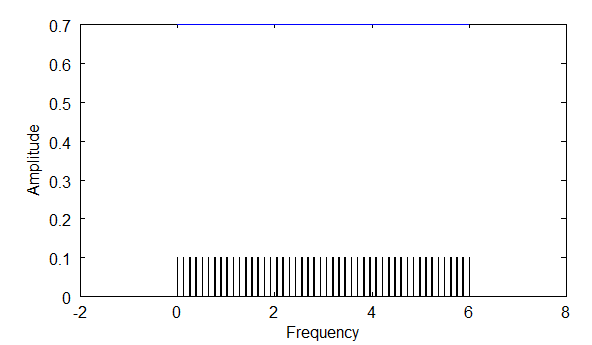
Above: diagram shows the density of frequencies you would see with f4, which is four times f1.
Notice that with longer wavelengths, you are able to find a higher density of frequencies via the orthogonality principle. Longer wavelengths mean smaller frequencies, and thus smaller steps between integer multiples.
So, then, extending the wavelength longer and longer will result in the density of frequencies identifiable along the spectrum increasing more and more. This means that as lambda --> infinity, f --> 0. F approaches zero, but never gets there.
Equation 2
At that point, all of the frequencies in the spectrum can be accounted for! This is what the Fourier Transform does. This allows you to deal with non-periodic waves.
However, the Fourier Transform no longer deals with integer multiples of the fundamental frequency. What happens is that you deal with all frequencies, and this affects the way you look at orthogonality, because between integer values there are non-zero areas. These non-zero areas are less than the values when the two sine waves are in sync, but they exist. These non-zero areas mean that this analysis is not ideal for finding sinusoids in a complex wave, but the method is still very good.
First, I'll give the equation for the Fourier Transform as it is usually given, with complex notation, equation 3.
Equation 3
That is nice compact notation, however in order to show better what is going on under the hood, I'll use sines and cosines. Here is a Fourier Transform in terms of sines and cosines, equation 4:
Equation 4
Notice the differences and similarities between the Fourier Coefficient equations for the Fourier Series and the Fourier Transform in equation 5, below.
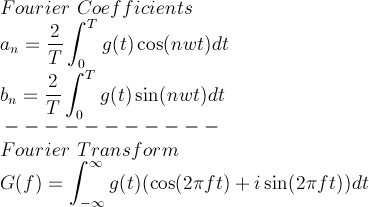
Equation 5
Some key differences. You don't divide by the period, T, or multiply by 2. Also, there are no longer integer multiples, i.e. 'n' is not in the Fourier Transform. You can select any frequency you want, which means you can also look at both periodic and non-periodic waves.
How the Fourier Transform Works
With Fourier Coefficients you find absolute values, since you are dividing by the period to get exact amplitudes for waves. However, with the Fourier Transform you only get the relative amplitude at different frequencies. This, however, is usually good enough.
Let's revisit the orthogonality principle. Remember, that the orthogonality principle gives a non-zero value when two sine waves have the same frequency, and a zero value when they have a different frequency, so long as we are dealing with integer multiples of the fundamental frequency. However, the Fourier Transform deals with all frequency values. So, here is how the orthogonality equation would look:
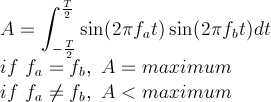
Equation 6
So, instead of zero, the values will be less than some maximum. The maximum is the peak value.
To show how the Fourier Transform works, I'll use this function, equation 7:
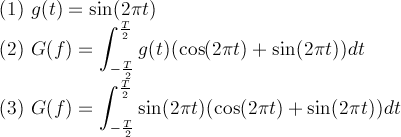
Equation 7
In equation 7, the simple wave (1) is plugged into (2) to get (3). Below are graphs showing the Fourier Transform plotted out as a spectrum. I've plotted it for three values of T in the diagrams below. The bigger the period, T, the higher the peak. So, as T approaches infinity, the peak becomes more and more pronounced. Also notice the "sidelobes". These are artifacts of the orthogonality principle when you are dealing with non-periodic waves, i.e. non-integer values of the fundamental frequency.
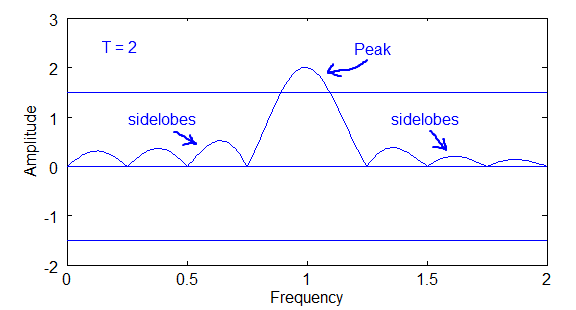
Above diagram of Fourier Transform plot for T=2
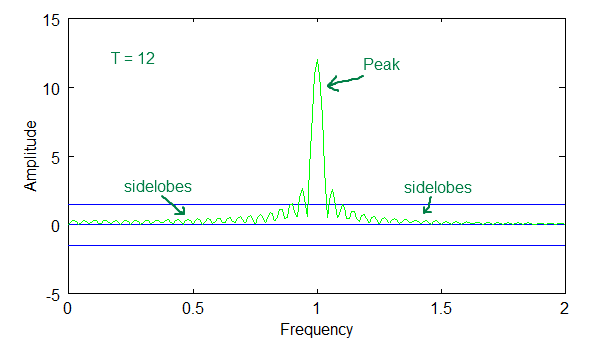
Above diagram of Fourier Transform plot for T=12
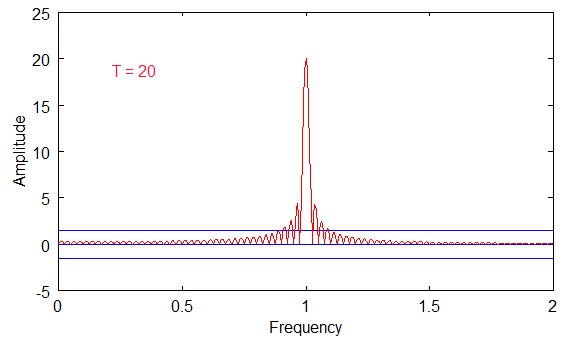
Above diagram of Fourier Transform plot for T=20
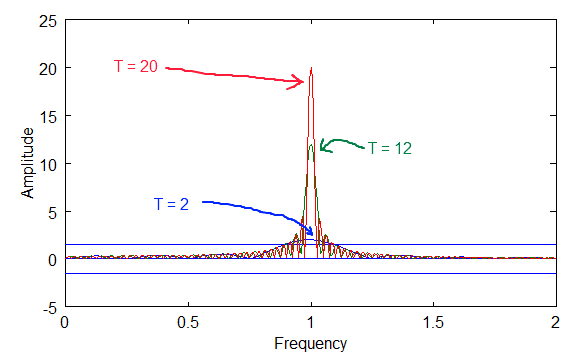
Above diagram of Fourier Transform plot for T=2, 12 and 20.
The last diagram above shows how the peaks overlap. Notice that the peaks get bigger with bigger periods, but the sidelobes stay in the same range.
Also, notice that the sinusoidal curve intersects zero at many points along the frequency axis for each of the T values. These zero intersections are the integer values for the fundamental, and the reason that the orthogonal principle is zero for the Fourier Series coefficients.
Hiç yorum yok:
Yorum Gönder